
Translate a chart or infographic image and keep the numbers right
There are two ways to translate a chart: rebuild it from its data in the target language, or translate the image you already have. If the chart still lives in Excel, Google Sheets or PowerPoint, rebuilding is cleaner. If all you have is a PNG from a report, a dashboard screenshot or a marketing infographic, an image translator replaces the title, axis labels, legend and notes in place. In both cases the numbers matter more than the words.
In short
- Have the data or the source file? Translate the labels there and regenerate the chart.
- Only the image? Upload it, choose the Technical Documentation or Marketing mode, and get a new image of the chart with the text translated.
- Check every value, decimal separator, unit and label against the original: number formats differ between languages, and a generated image can alter a digit.
Rebuild the chart or translate the image?
| What you have | Best method | Why |
|---|---|---|
| Excel, Google Sheets or Numbers file | Translate the labels in the sheet, regenerate the chart | Values stay linked to the data and text stays editable |
| Native chart in PowerPoint or Google Slides | Translate it in the deck | See how to translate a PowerPoint and how to translate Google Slides |
| Chart pasted as a picture in a deck or document | Translate the image | Google Translate's document translation leaves text inside images untranslated (Google Translate Help) |
| PNG or JPG in a report, PDF or web page | Translate the image | There is no source to edit |
| Dashboard you cannot change | Screenshot it, then translate | See the screenshot translator |
Number formats change between languages
The same value is written differently depending on the language. These conventions come from the Unicode CLDR locale data used by most software (CLDR number symbols):
| Language | Decimal separator | Thousands separator | 12345.6 written as |
|---|---|---|---|
| English | point | comma | 12,345.6 |
| French | comma | space | 12 345,6 |
| German | comma | point | 12.345,6 |
| Spanish (Spain) | comma | point | 12.345,6 |
| Portuguese (Brazil) | comma | point | 12.345,6 |
| Japanese | point | comma | 12,345.6 |
Two more differences show up in charts. French, German and Spanish (Spain) put a space before the percent sign (50 %) and place the currency symbol after the amount, where English writes 50% and puts the currency symbol first (CLDR patterns). Spanish as written in Mexico and the United States follows the English conventions instead (12,345.6, 50%, currency symbol first), so check which market the chart is for. Large-number words are a trap too: in French, "un billion" is a million millions, so an English billion is "un milliard" (Larousse). An axis titled "Revenue (billions)" must not become "billions" in French.
What our demo sample shows
The spec-sheet infographic below is one of our demo images, followed by the French version our image translator generated from it.
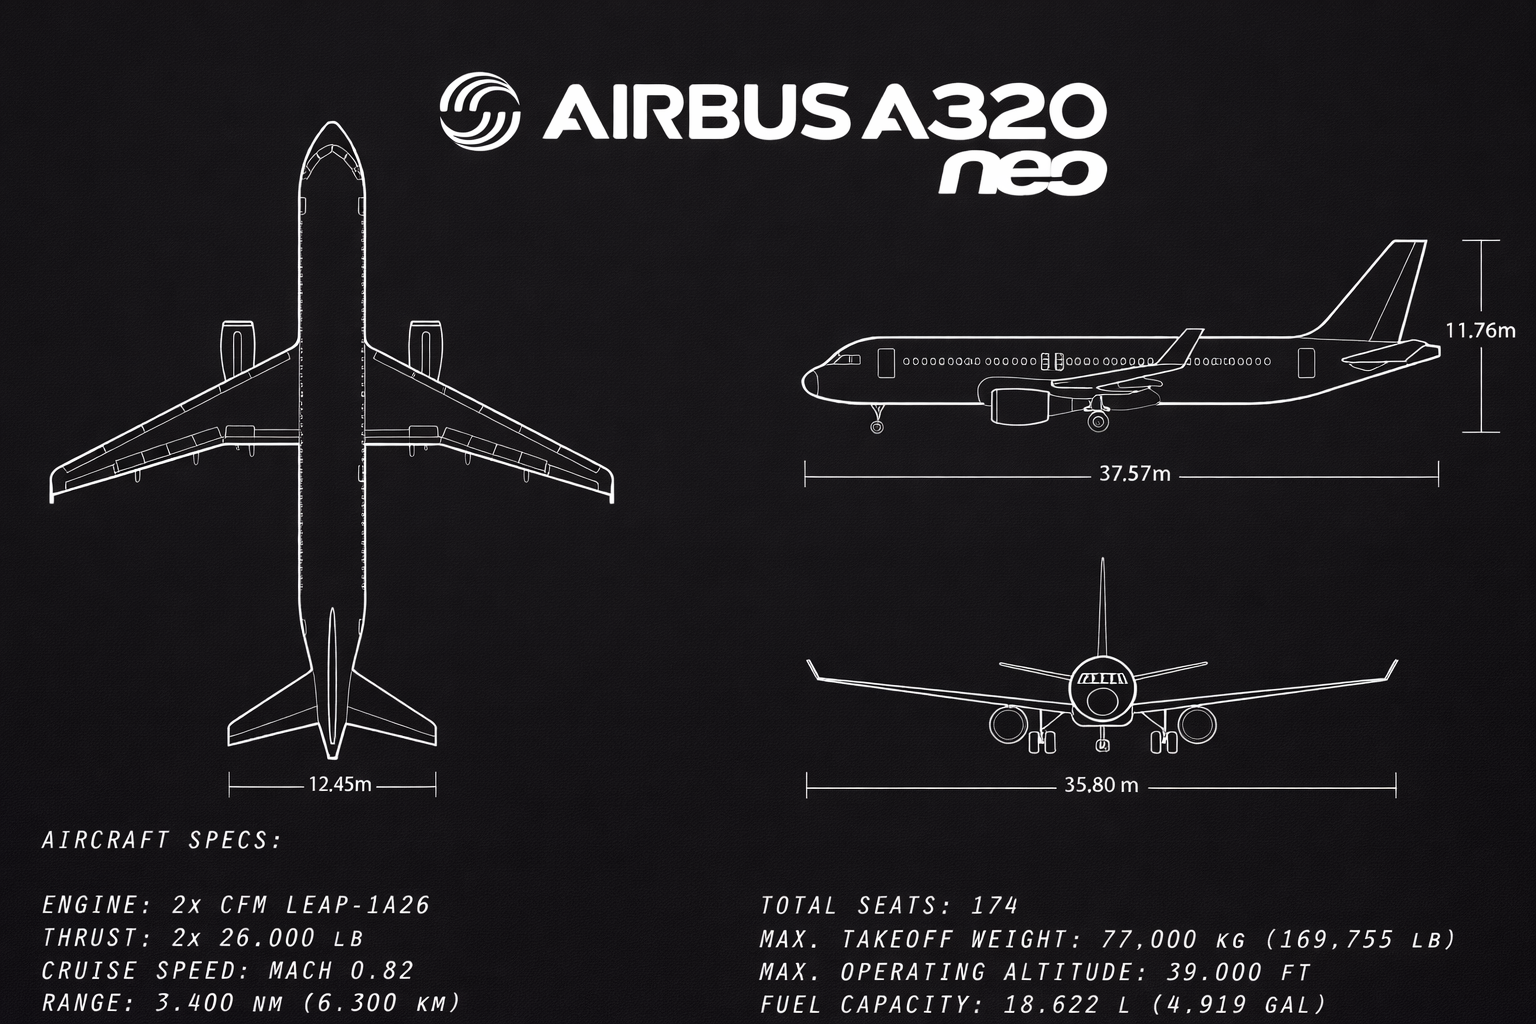
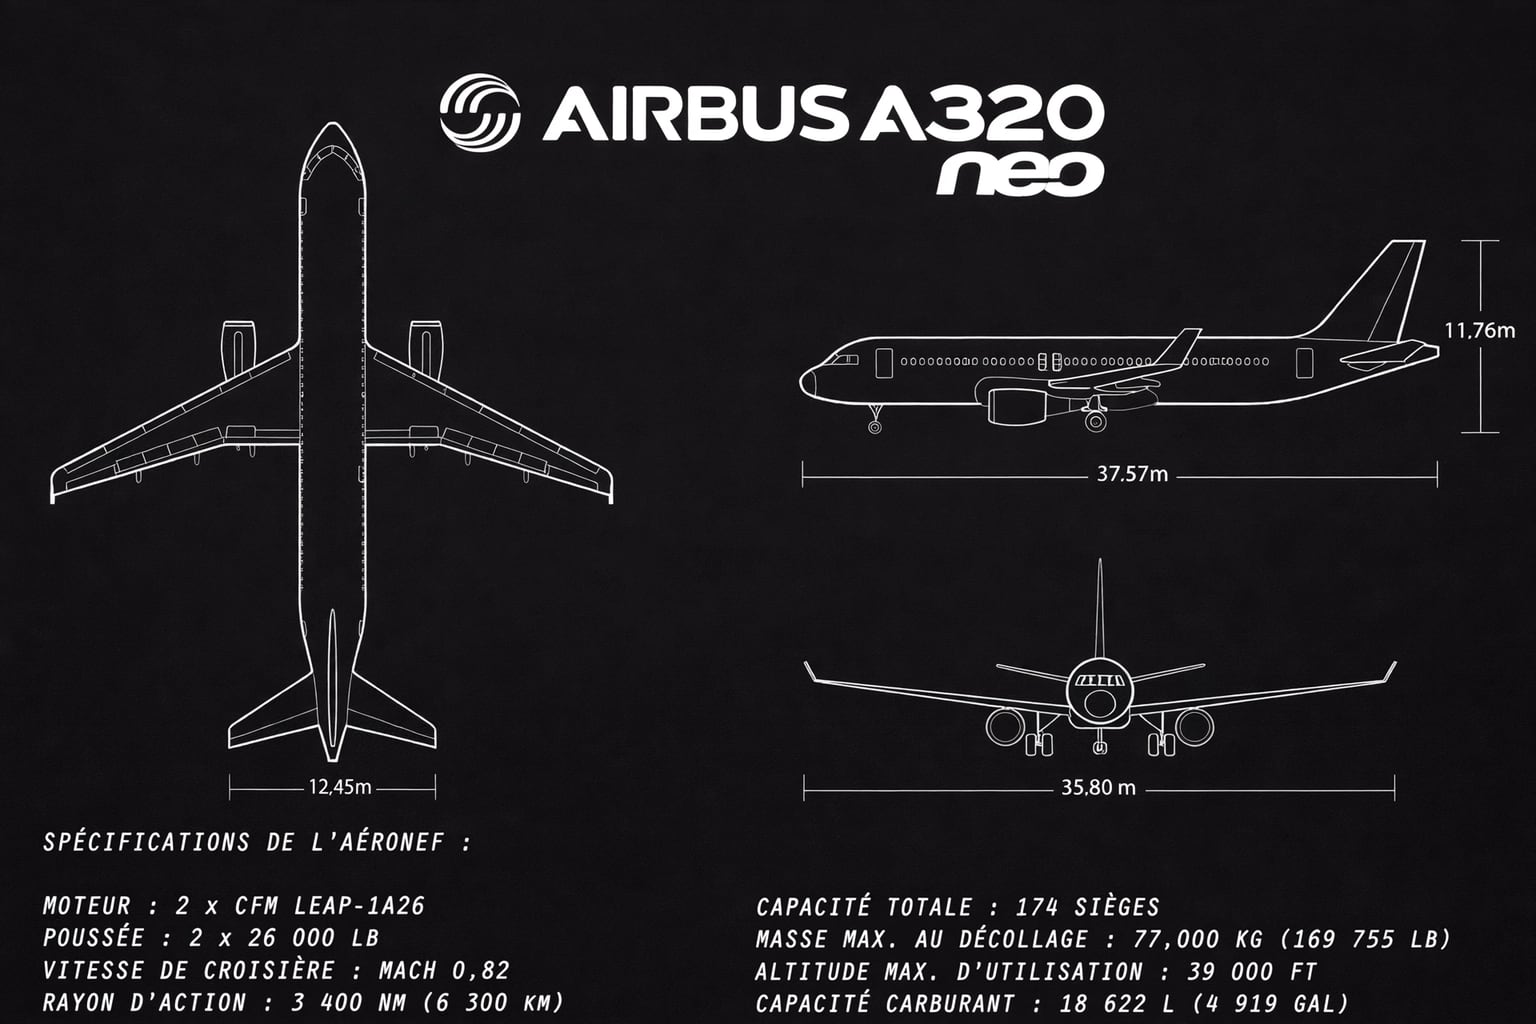
Here is how the numbers came out in the French, Japanese and Portuguese versions:
| Original | French | Japanese | Portuguese |
|---|---|---|---|
| 2x 26.000 LB | 2 x 26 000 LB | 2基 26,000 lbf | 2x 26.000 LB |
| 77,000 KG (169,755 LB) | 77,000 KG (169 755 LB) | 77,000 kg (169,755 lb) | 77.000 KG (169.755 LB) |
| 3.400 NM (6.300 KM) | 3 400 NM (6 300 KM) | 3,400 NM (6,300 km) | 3.400 NM (6.300 KM) |
| MACH 0.82 | MACH 0,82 | マッハ 0.82 | MACH 0,82 |
What worked: thousands separators were adapted to each language almost everywhere (space in French, comma in Japanese, point in Portuguese), even though the original mixed "26.000" and "77,000", and the Mach number got a decimal comma in French and Portuguese. Units (LB, KG, NM, FT, GAL) were kept rather than converted, which is what you want: converting units is an editorial decision, not a translation. The Japanese version still restyled them: lowercase kg, lb, km, ft and gal, and "lbf" (pound-force) for the thrust.
What a reviewer would fix: in French, "77,000 KG" kept its comma, right next to "169 755 LB". A French reader takes that comma for a decimal separator, so the weight reads as 77 kg. A rule applied to most numbers on a page is not necessarily applied to all of them, so every value needs the same check, including those near the edges of the image.
How to translate a chart image
- Export the chart at the highest resolution you can. Crop to the chart with its title, legend and source line. JPG, PNG or WebP, up to 10 MB.
- Upload it to the image translator, choose the source language (or Auto-detect) and the target language.
- Pick the mode in the Business type menu. Technical Documentation for report charts and dashboards: it asks the model to keep the information hierarchy and to translate measurements correctly. Marketing for promotional infographics; the ad image translator covers that side. The menu is shown on wide screens; on a smaller one, signed-in users can save a default business type in their profile.
- State the number format on the Pro plan or above. In the custom AI instructions, write for example "Use French number format: space for thousands, comma for decimals. Do not change any value."
- Download and review with the checks below.
Chart-specific checks
- Data labels and axis values: every value identical to the original, with the same number of decimals.
- Axis titles and units: the unit is still there, and abbreviations for thousands, millions and billions mean the same magnitude.
- Dates: abbreviated months on the axis are translated (in CLDR data, Jan becomes janv. in French and ene in Spanish), and numeric dates are not ambiguous (03/04 is March 4 in the US and 3 April in most of Europe).
- Legend: every series name is translated and still matches its color. If the original legend was alphabetical and the translation keeps the original order, it may no longer be.
- Footnotes and source lines: the small print at the bottom is translated too and still legible.
- Callouts: each label still points to the right bar, line or slice.
Infographics: dense text in fixed boxes
Infographics combine many short labels with paragraphs in fixed boxes, and short labels grow the most in translation: IBM guidance quoted by the W3C lists an average expansion of 200–300% for English strings up to 10 characters translated into European languages (W3C). The longer text has to fit the same boxes, so check that it is still legible in French, Spanish or German versions. If an infographic is very dense, translate it in sections (crop each panel), check each one, then put the panels back together in your editor.
Right-to-left languages
Arabic and Hebrew are not in the main uploader, but language pages such as translate images to Arabic cover them. The translator is instructed to keep the original layout, and nothing in its instructions asks it to mirror a chart for right-to-left readers. Whether a chart should be mirrored for right-to-left readers is an editorial decision; if it should, rebuild it from the data. Going the other way, from an Arabic chart to English, raises its own checks (Eastern Arabic digits, Hijri dates): see the Arabic image translator.
Charts are not diagrams: labels on technical drawings, schematics and flowcharts are covered by the diagram translator.
Translate a chart image
Upload a chart or infographic, choose the Technical Documentation mode and check every value against the original before you publish it.
Frequently asked questions
How do I translate a graph or chart?
If you have the data or the source file (Excel, Google Sheets, PowerPoint), translate the labels there and regenerate the chart. If you only have an image, upload it to an image translator, choose the target language and compare every value, label and unit with the original.
Can Google Translate translate a chart?
The Images tab of the Google Translate website can read the text in a chart image and lets you download a translated version; Google notes that small, unclear or stylized text can lower accuracy. When you translate a whole document, Google's help center states that text inside images is not translated, so charts pasted as images in a .docx, .pptx or PDF stay in the original language.
Will the numbers in my chart change?
The values should stay the same, but the image is regenerated, so a digit can be misread or altered. Thousands and decimal separators may also be adapted to the target language. Compare every value with the original before you publish the chart.
Should I convert decimal separators when I translate a chart?
For readers in the target language, usually yes: French, German and Portuguese use a comma for decimals, and so does Spanish in Spain (Spanish in Mexico and the United States uses a point). What matters most is consistency within the chart. From the Pro plan, you can state the format you want in the custom AI instructions, then check every number.